What do roof angles have to do with sustainability in the public sector? A new project by Ordnance Survey has set out to answer this question, alongside many other uses for their new dataset. GT caught up with Tim Chilton, UK consulting lead at Ordnance Survey, to find out more.
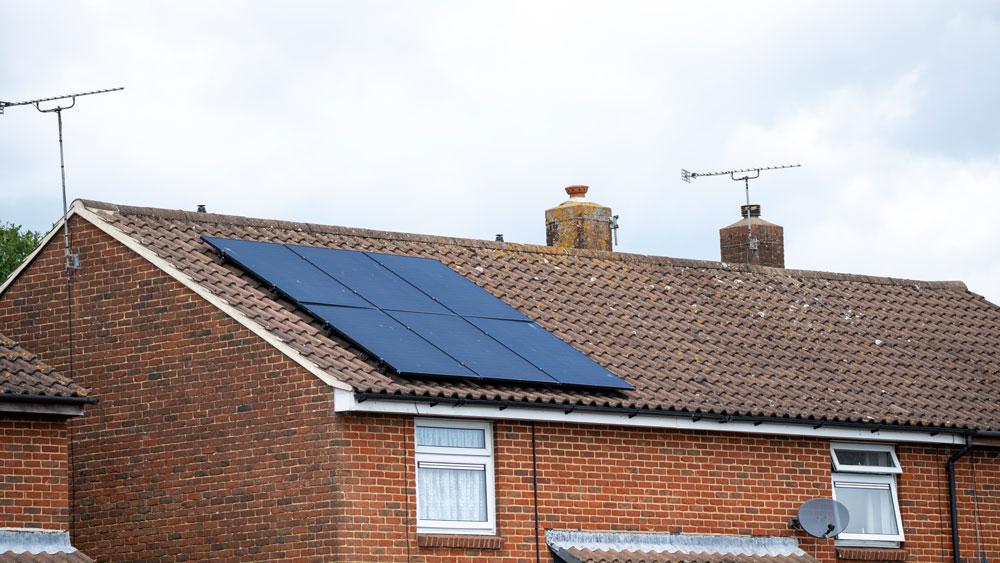
Ordnance Survey (OS) has recently launched several open datasets on Snowflake Marketplace to increase access to their data, which has led to a new concept created from data on roofs, “Slopey Roofs”. Built on Streamlit in Snowflake, Slopey Roofs combines data from the Met Office and OS to provide a comprehensive dataset accessing roof suitability for solar panel installation. This is done by using solar data from the Met Office, whereby roofs are evaluated on how much sun exposure they receive, then combining it with data on roof angle from OS. To make the data even more accessible, OS colourcode their map to differentiate the suitability of roofs for solar panels.
These datasets are available on Snowflake, which allows users to both store their own data, as well as accessing other organisations’ data, and additionally allows for the presentation of this key data, which is beneficial for the visual element of Slopey Roofs. This makes Slopey Roofs a demonstrator. Here, Tim explains: “It’s a demonstrator to show, with these datasets already held in Snowflake, what we can do, produce and visualise to help customers of different types.”
OS here is working with two primary datasets: the OS National Geographic Database (NGD) which describes the geography of Great Britain, including buildings, and Met Office data on weather patterns across the year. The project came out asking what would this geographical data, with a renewed focus on buildings and houses, look like if it was combined with Met Office data about the weather?
And so Slopey Roofs was born. Tim expands: “With the information Ordnance Survey gives us about buildings and their ability to have solar panels, what could that mean for the amount of energy that a building could receive? And could that information be useful to local authorities?”
Slopey Roofs, in essence, combines several procedures into one space: customers and organisations are able to access data that reveals housing stock, roof data, and solar panel eligibility, which has many potential uses. We ask Tim to explain further.
How might individuals be interested in accessing and using the Slopey Roofs data?
Tim contemplates this question as he envisions Slopey Roofs to have the biggest impact for organisations. The interested individuals, he says: “would be potentially in the utility sector, understanding energy capacity requirements, and new housing developments. Some of these developments may have solar roofs, for example, and grid connectivity is a major issue for housing schemes under the government’s new 1.5 million housing target.”
Analysts would have a lot to gain from OS’s Slopey Roofs data. Especially those that already work within housing or energy sectors, and would benefit from the meshing of different datasets to create a comprehensive pool of information.
Those working in planning and insurance would be able to benefit from information about a roof’s incline, as flatter roofs are more vulnerable to damp. Additionally, the data would also be useful to support climate mitigation and adaption policies regarding the efficacy of solar panels on certain buildings. This leads us on to our next question.
The UK has set an ambitious target to have 95 per cent of its energy clean by 2030. How can your work with Slopey Roofs and Snowflake support this?
It’s important here to differentiate climate mitigation, to reduce or prevent a rise in temperature, from climate adaptation, which is to make adjustments in the way we live our lives in response to current and predicted consequences of climate change. OS’s data on Slopey Roofs can help with both of these, with huge potential for its capabilities to only increase.
The data brings valuable context to a situation that might not seem like the obvious first answer. When thinking about how buildings might be adapted to be resilient against the effects of climate change, roofs might not necessary be the first port of call when assessing flood risk. But using interconnecting datasets that give a wider context, you can create a wider picture of the environment and surrounding land.
Further data gives details such as if the site is low lying or near water courses, which make mitigation methods easier. When datasets intersect, they form a web of information that can be used to make informed, accurate decisions.
Assessing criteria like flat roofs with little drainage, as well as nearby watercourses and low-lying land, developers are able to consider appropriate drainage systems.
But the most exciting part, Tim emphasises, is that there is much more to come, with little limit to the possibilities, and each new data set adding more value to the existing information available.
Do you have any data specifically on these public sector buildings like hospitals, schools and council buildings, and how might they use this to their advantage?
Tim points out that is important to remember that what we might call public sector buildings, are actually sites made up of several buildings. He explains: “It’s less that its public sector, it’s more that those types of buildings that you’re referring to are part of a bigger estate of available land and building type and roof complexity.”
Here, the data from OS would work to demystify net zero technologies, through presenting valuable insights clarify to the process. Knowing whether or not a building can facilitate solar panels, or even whether they would get enough sunlight, would allow funding and energy to be directed into channels early in the process, saving time and manpower.
Tim agrees. Snowflake’s data breaks down complicated decisions into manageable actions and would help public sector sites weigh up initial investment with predicted output. Especially as MetOffice data would give a rough estimation of how productive solar panels would be in any given place.
Investing in decarbonisation technology is never cheap, and the public sector faces the additional challenges of external budgets set for them, many of these not allowing much wriggle room. Public sector sites might know they want to make an investment, and yet not have the funds to do so immediately, and so the Slopey Roofs data can assist in a more phased approach, by highlighting the best areas to start with. Placing the first solar panels in areas with the most hours of sunlight, for example, would be the most effective approach.
What do you think might the future of this tool be? Where might it go and what potential is there for Snowflake’s Slopey Roof’s project to harness AI?
Because the possibilities are endless, they are likely to be shaped by organisations’ and customers’ demands. Tim expands: “Our honest answer is that we’re building some confidence for ourselves and our use of Snowflake in doing Slopey Roofs.”
As for AI, where Snowflake already uses AI to summarise information, Tim confirms it retains structured data accurately. Its capabilities are likely to only advance, and being able to summarise complicated datasets, graphs, and maps into digestible texts further increases the Slopey Roofs project’s accessibility and uses, meaning more and more people are able to take something away from this information.
In summary, the collaboration that has brought this concept together showcases the potential in developing data apps and securely sharing live data across government and private sectors – all working towards greener energy solutions. Slopey Roofs is a great example of how collaborative, data-driven innovation can support the UK’s sustainability goals.